
Design thinking is pivotal to our work at Intevity. It’s a big part of our toolkit in human-centric work. In a previous post, we outlined how Design Thinking drives innovation. In this post, we’re sharing our 14-step process for maximizing our Design Thinking efforts.
Step #1: Planning
The first step of planning is to identify objectives. Common objectives for research are:
- Filling gaps in understanding
- Creating empathy with users
- Making an investment decision
- Identifying opportunities for improvement
- Making a design decision
- Evaluating potential solutions
After objectives have been identified, the specific research methods should be evaluated. A well rounded study should consider both qualitative and quantitative research. Beyond the types of research objectives, research methods will depend upon several factors including:
- How large is the pool of potential users?
- How many types of users exist?
- How accessible are the various stakeholder groups?
- Is there concern with how users feel (attitudinal)?
- Is there concern with how users work (behavioral)?
- Is there a need to understand the why and the how (qualitative)?
- Is there a need to understand how much or how often (quantitative)?
Based on the answers to these questions, the available research methods can be examined. The Nielsen Norman Group has published a useful guide on matching research methods across the dimensions of:
- Behavioral vs. Attitudinal
- Qualitative vs. Quantitative
- Context
In practice, while many organizations would like to include a significant quantitative aspect to their research, they often lack the resources necessary to do so.
Step #2: Prioritization
Prioritization is important during the planning process. In large complex systems with diverse stakeholder groups, it may be necessary to break them into multiple tiers. This would be based on the level of impact or degree of influence any stakeholder(s) have on a system. During the initial Experience Research phase, only top tier users and critical influencers will be researched. Secondary and tertiary tiers may not be addressed until much later.
Once the objectives, methods, and users are identified, a lightweight plan should be documented along with the high-level research questions to be asked. For large-scale projects and programs, this plan should be integrated with the overall project plan––especially the communication management and stakeholder management plans.
Step #3: Conducting
Conducting research is often an iterative process. In many cases, the answers to one set of questions leads to more questions. It takes practice to discern which questions are essential to answer during Experience Research and which can wait until later. A few key points to remember when conducting research:
- Understand your biases and actively work to offset them
- Do not try to solve problems
- If the research method is purely observational then observe––do not engage and do not interfere
- Be ready to adjust
- Whenever possible, observe users in their natural habitat. Lean calls this Gemba.
One of the biggest challenges for researchers is obtaining enough participation. That said, 5-10 participants per stakeholder group is often enough when conducting interviews and usability tests. With that number, responses tend to harmonize and insights gleaned from additional interviews or observational studies begin to decrease significantly. However if responses are divergent, it may be necessary to re-evaluate the stakeholder groups. It might be that there’s a subtype of user unaccounted for.
Whenever possible, record sessions. Recordings allow other project team members to obtain a better or different understanding of any responses. It also enables a researcher to focus on the conversation instead of taking notes. Before any recordings, be sure to understand the policies, procedures, and relevant laws. And always obtain written consent beforehand.
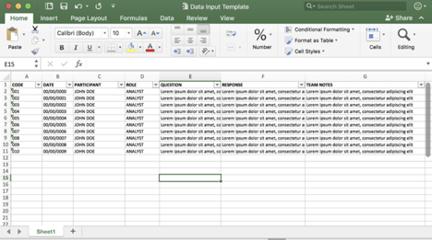
After completing a session, it’s essential to document and code the session. Coding is the process of organizing research and responses in a meaningful way. This may take many different forms and is often done in a spreadsheet. It organizes and begins the synthesis process by homogenizing the data to recognize patterns and trends. It also helps with data sorting data. Tally marks and prioritization matrices are additional examples of coding. Artifacts that may be produced during this stage are:
- Personas
- Journey Maps
- Affinity Diagrams
- Mind Maps
- Process Flows (current state)
Step #4: Synthesizing
Synthesis is the process of analyzing the research to look for patterns, unexpected connections, and root causes of user behaviors, frustrations, and needs.
Often synthesis will raise additional questions and several passes may be required to arrive at the answers that define the mission, strategy, and tactics for the initiative or product. This fits with the models of design thinking, lean, and iterative product development.
Synthesis During Research (a.k.a. Big Synthesis)
Synthesis in the context of Experience Research often requires additional research and design activities to validate before formal development begins. When synthesis is done in the context of targeted or ongoing research, limited validation or small-scale validation may be required.
In a multi-month Experience Research effort, it may be necessary to conduct a follow-on design or prototyping phase to validate the proposed approach coming out of synthesis. However in the context of a Design Sprint, validation may be as simple as running a usability test on a paper prototype during the final day of the sprint.
Experience Research Artifacts Examples
The outcomes and deliverables of synthesis depend on the type of Experience Research performed or where in the Experience Research process it takes place. The table below outlines the outcomes and the examples of potential deliverables by Experience Research type:
| Experience Research Type | Desired Outcomes | Potential Tactics and Artifacts |
|
Mission Development |
Alignment on:
|
Artifacts may include:
|
|
Strategic Planning |
Alignment on:
|
Artifacts may include:
|
|
Tactical Planning |
Definition of:
|
Artifacts may include:
|
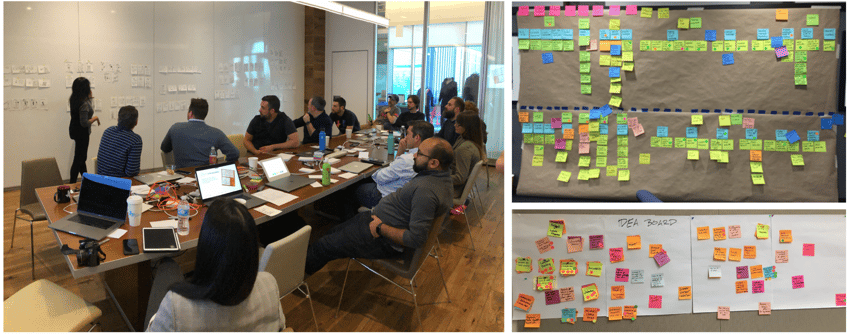
Step #5: Workshops
Workshops with stakeholders allow for collaborative brainstorming and prioritizing of feature sets. This prioritization is based on business’s highest priorities and what is likely to generate the most value.
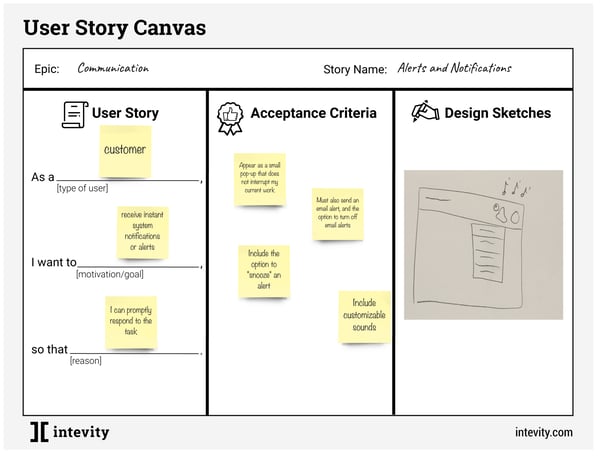
Step #6: Story Mapping
Story mapping is used to decrease risk and rework strategies. It does this by developing detailed user stories and acceptance criteria in collaboration with the business. User stories are written in plain language, and detailed descriptions of a desired system functionality are written from the user's perspective. These are a convenient way of expressing business needs to various audiences. When done in a collaborative workshop, stakeholders are able to articulate exactly what functionality they are looking for and sketch out ideas.
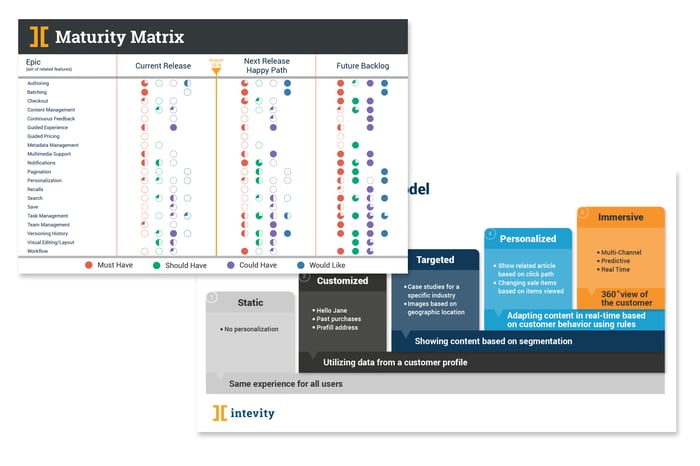
Step #7: Maturity Matrix
To illustrate scope and sequencing, epics are aggregated in a Maturity Matrix. Epics are large feature sets used in agile software development. We often use the MoSCoW method to help stakeholders prioritize functionality. The Maturity Matrix shows how functionality develops over time––starting with the current state.
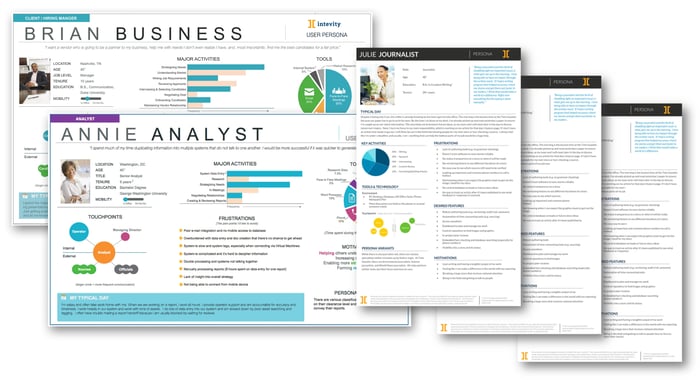
Step #8: Personas
Personas are fictional, composite characters created as a part of Experience Research. They represent different user types by expressing their major needs and expectations. This memorable cast of characters can focus conversations about feature prioritization and toward the needs of real people and real behaviors.
Personas are typically separated into two or more tiers. The tiers represent the relative weighting of persona’s impact on the overall solution.
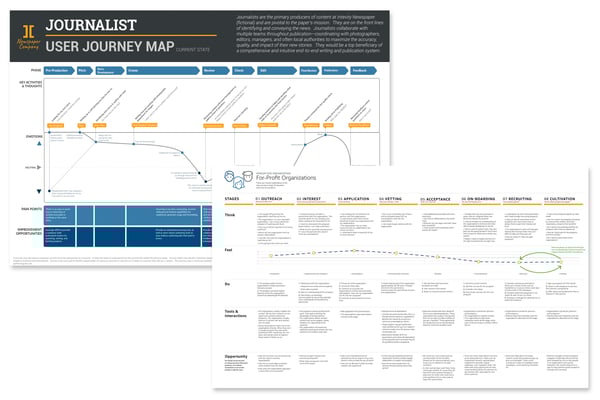
Step #9: Journey Maps
Journey maps are used to document a business process from the perspective of a persona. They help teams understand how a persona fits within their current process. They also also identify motivators (positive emotions and interactions) and demotivators (negative emotions and interactions).
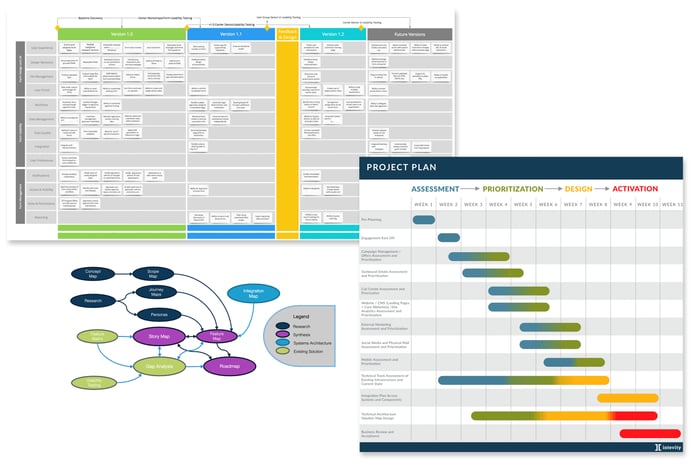
Step #10: Roadmap/Planning
Roadmaps bring all research and definitions into a single track that outlines implementation for planning purposes.
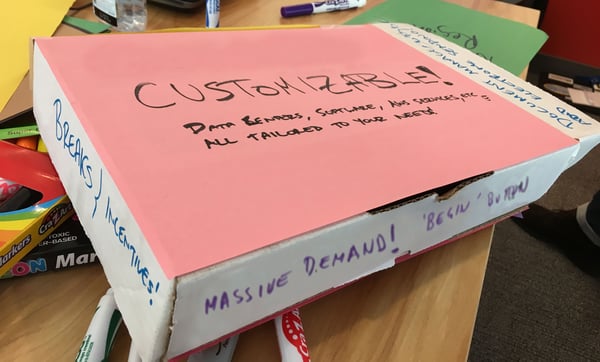
Step #11: Product Box
Product boxes are created with stakeholders to better understand what product their business wants customers to buy. They also elucidate problems that customers are trying to solve with the product.
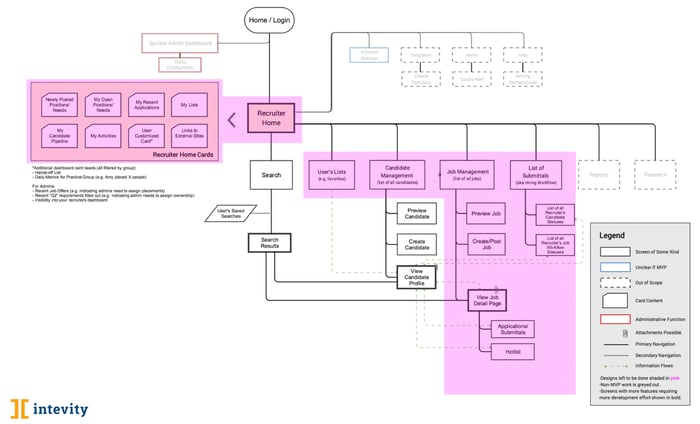
Step #12: Site Map
A site map is a visual diagram showing the hierarchical linking of pages within a website. The map uses lines to show how pages branch out and connect to each other.
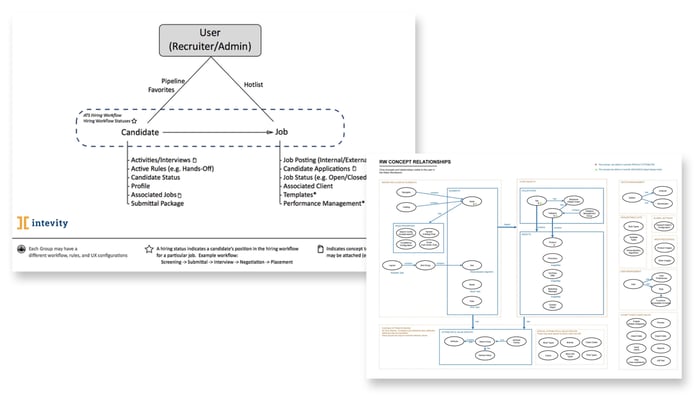
Step #12: Concept Maps
A concept map is a graphical representation of how key organizational concepts relate to each other.
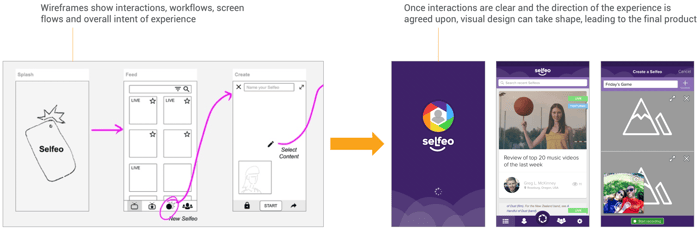
Step #13: Wireframes and Visual Design
Wireframes are low fidelity, concept driven visuals focused on interaction. They eventually give way to better finished products.
Design Thinking is a brilliant tool for innovation. It allows stakeholders to be involved at almost every step. It also constantly demands thinking, questioning, and iterating.